
Timeline
2024.2-2024.7
Role
Product Designer
Front-end Engineer
Hardware Engineer
Contribution
-User Research
-Prototyping, Usability Test
-Web Design & Back-end data connection
-Hardware & Software Development
Tools
Figma
Html, CSS
Fusion 360
Arduino
Methods
-Research Methods: Interview, Contextual Inquiry
-Analysis Methods: Affinity diagram, Triangulation Ideate, Information Architecture, Wireframes,
-Usability Test Methods: Click-through Mockups, A/B Test, heuristic evaluation
Problem Highlights
Current agricultural practices lack an efficient, automated system for real-time, easy detection of small pests, complicating pest management.
Solution Highlights
an IoT-based system in hardware software device learning to remotely and accurately detect pests, delivering real-time alerts to mobile devices for efficient farmland management.
▶️ Fully Workable Deliverables


Process

Understanding the business | REQUIREMENT GATHERING
Market Conditions
Current solution providers mainly target large farms and are often expensive, leaving a gap for affordable options for small-scale farms. And the market segment for IOT is predicted to reach 2227 billion on 2028.
Target Market
The agricultural IoT market is estimated to grow from USD 11.4 billion in 2021 to USD 18.1 billion by 2026 at a CAGR of 9.8% during 2021-2026.

Market Opportunity
There is a lack of low-cost, easy-to-use products for small-scale farms, presenting a significant market opportunity.

Business Goal
Our business goal is to capture the overlooked small farm segment by offering affordable, automated IoT solutions that are easy to install, low-maintenance, and streamline farm management.
Response to business goal
Our product will have these features
Affordability
Ensure the product is cost-effective to attract small-scale farmers who may have limited budgets.
User-Friendly Interface
Design an intuitive and easy-to-use interface to minimize the need for extensive training and reduce learning time.
Data Analysis and Recommendations
Provide smart IoT applications that analyze collected data and deliver actionable insights to help farmers make informed decisions.
Low Maintenance
Design the system to be low maintenance to reduce ongoing costs and efforts for the farmers.
Exploration of the why and who | RESEARCH


Primary Research

Triangulation
Secondary Research

Pest & Diseases
"Pest problems and crop diseases on U.S. farms are a major issue for the agricultural industry."


Precise Timing of Pest Occurrences
"The lack of timely information results in excessive pesticide spraying, as farmers extend the duration of pesticide application and increase patrols to mitigate potential pest damage. This practice leads to substantial resource waste and environmental impact."
interview our sponsor(main customer)
We visited our sponsor Nelson Andrew in his farm in east Washington. Through Context Interview with him, we get a lot of related information and get to know about his main pain point is lack of an efficient, automated system for monitoring small pests in current agricultural practices. While pea weevil is his farm's primary concern. These pests challenge farmers seeking effective management to protect crops and maintain productivity.
Affinity Diagram
Main Pain Points
User Usage Difficulty - data transmission barrier
"The moisture sensors can only be read locally; cannot transfer data to the user's side."
"Current devices are restricted by Wi-Fi, and using a SIM card may cost 30 dollars per month to transmit data."
Power supply and consumption
"The power panel of the current FarmGazer is overproducing power."
"Cost management is extremely important to big farms. Lowering the cost per unit saves a lot."
Q&A Assistance Demand
"GPT assistant quick check fields."
"See how many pea weevils were collected in different areas of the field, which is currently all done by humans."
Need Consistent Monitoring with Little Labour
"He can only check pea weevils once a week in person (there's at least a 7-day gap between two checks)."
"Pea weevils are his biggest problem because they are sneaky."
"The current method of measuring pea weevil dangerous levels: 5-10 swipes with a net back and forth over the plant to get a sample."
"Sometimes the pea weevil attack could appear right after the check, and they cannot handle it in time."
"The overall production of peas could be halved, leading to a loss of thousands of pounds of peas if the farmer cannot spread the chemicals in time."

User Flow Map
Design thinking Example: device management system design
Device list & map view
Check Certain device
overall device settings
add new device
warning settings
Device picture library
Set Photo Capture Interval
check more date
go to community to ask other farmer
Or AI bot
request maintainance
ask device to take a real-time picture
manually change pest number
device broke
check next one device
Safe
data wrong
No
Yes
Dangerous
Design Thinking:
Original Design: The device's database and devices' overall settings were placed on the same page.
Observation: Users generally apply "device warning ranges" to all devices, rather than individual ones. However, settings like "photo capture interval" may vary by device based on the area's pest damage level.
Design Thinking:
The photo capture is triggered by an IR sensor to save power, with an interval function as a backup if the sensor fails. While a user suggested shortening the capture interval in areas with severe peaweevil problems.
Design Thinking:
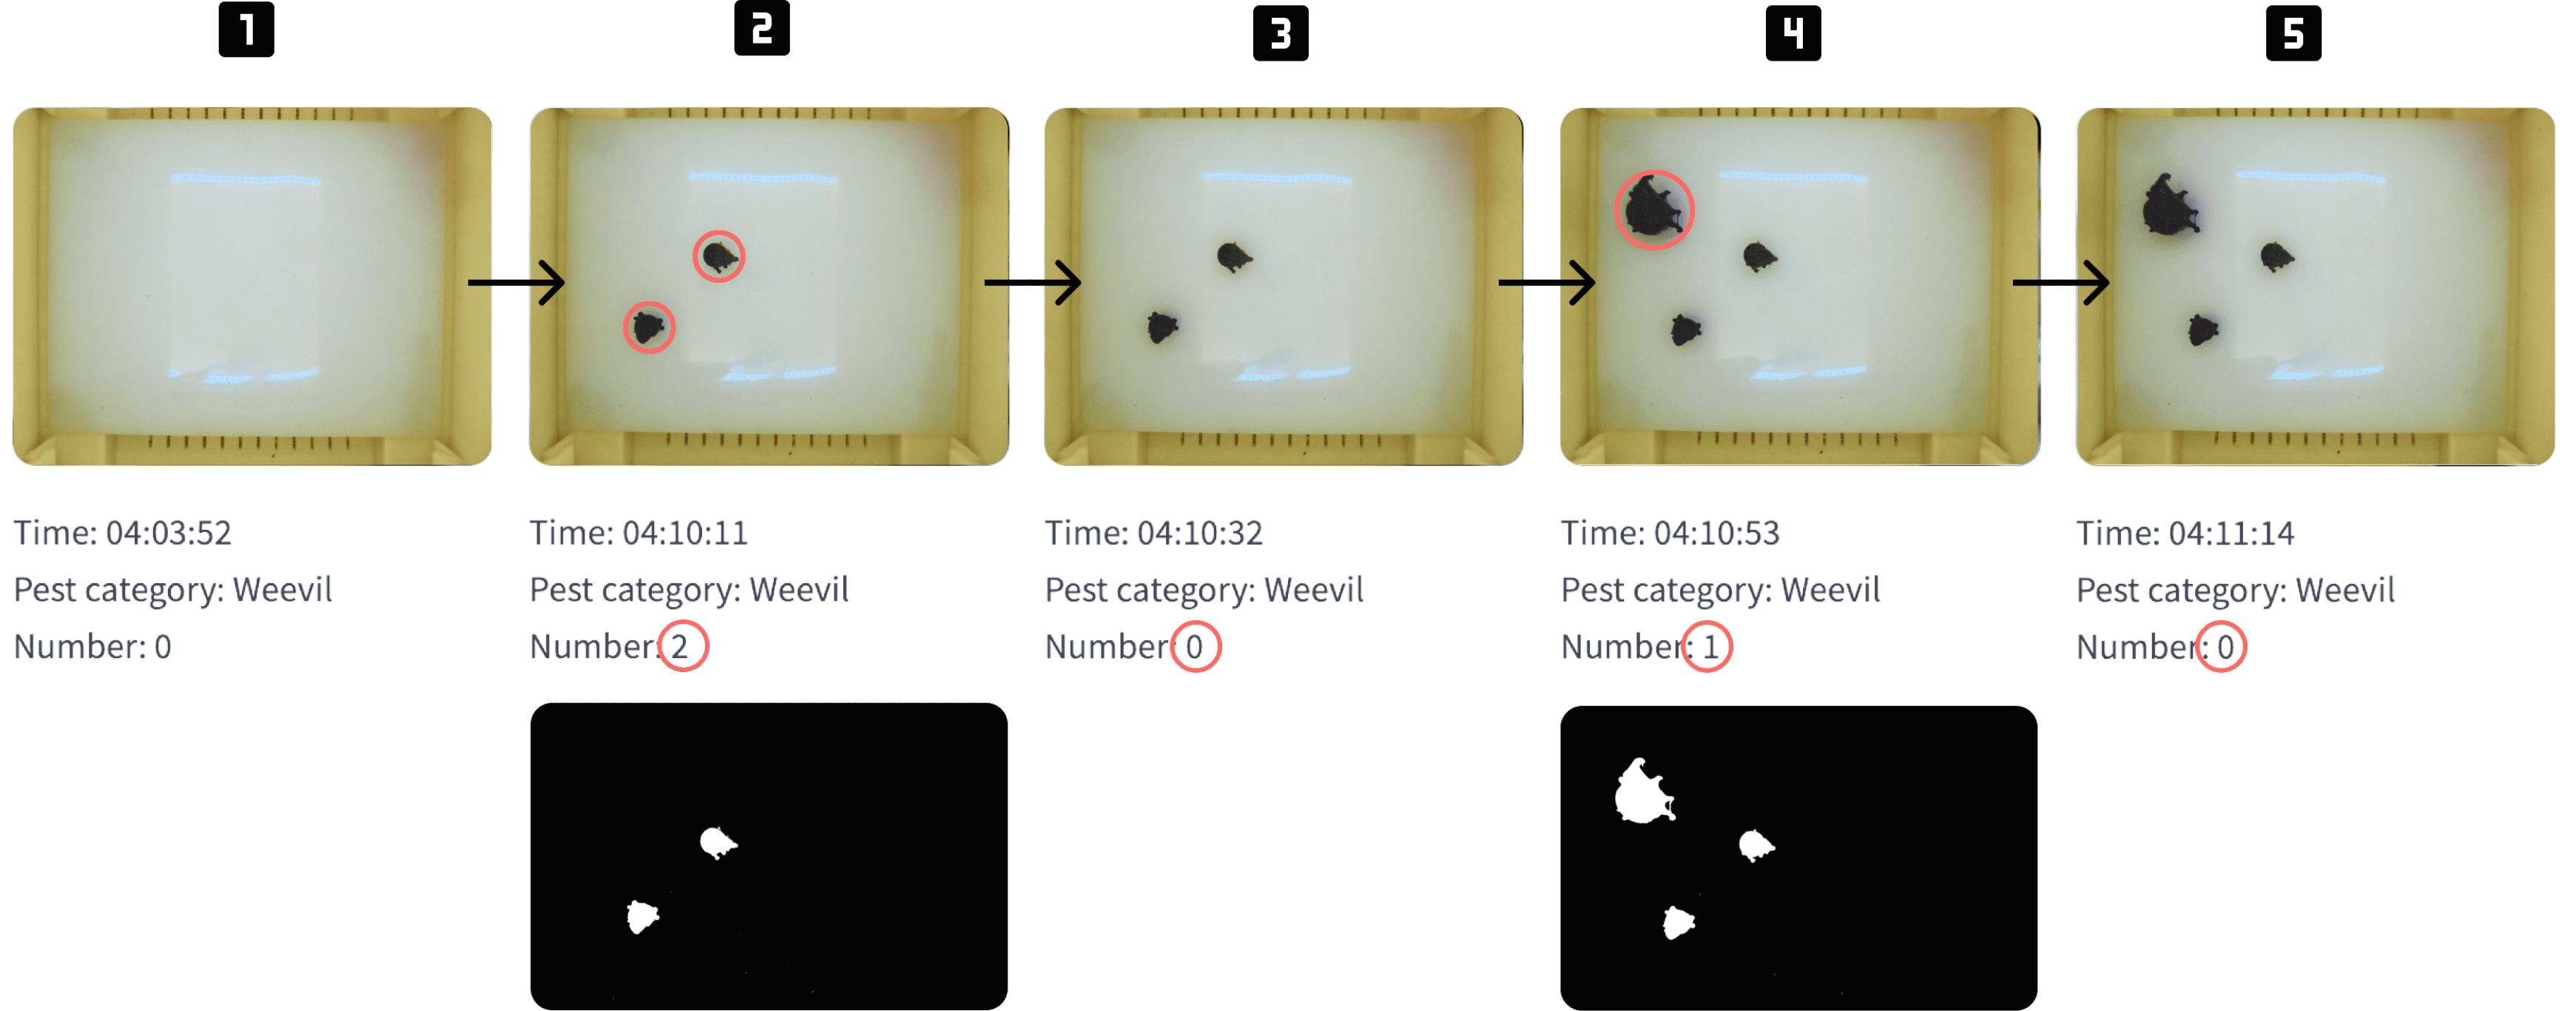
While our computer vision algorithm can reach 90% accuracy, there are still errors when the system counts the number of peaweevils. As requested by our customer, they would like to manually change the pest count in the database for more accuracy when the number counted by the system differs from what they observe.
IDEATION | Hardware Device
Hardware Design Consideration
Efficiency
Use traditional method—-Pheromones to attract peaweevils, so we could estimate the overall extent in nearby field.
Power Saving
Camera not always open, only be triggered when IR sensor detected there are pests fly in.
Computer Vision and DSP
Use camera module to count the item amount. Use digital signal processing to filter out only peaweevils. See greyscale algorithm in the end.
Data Transmission
Transmit pictures and data to Azure Cloud through WiFi. Run computer vision code on remote device to save local storage.
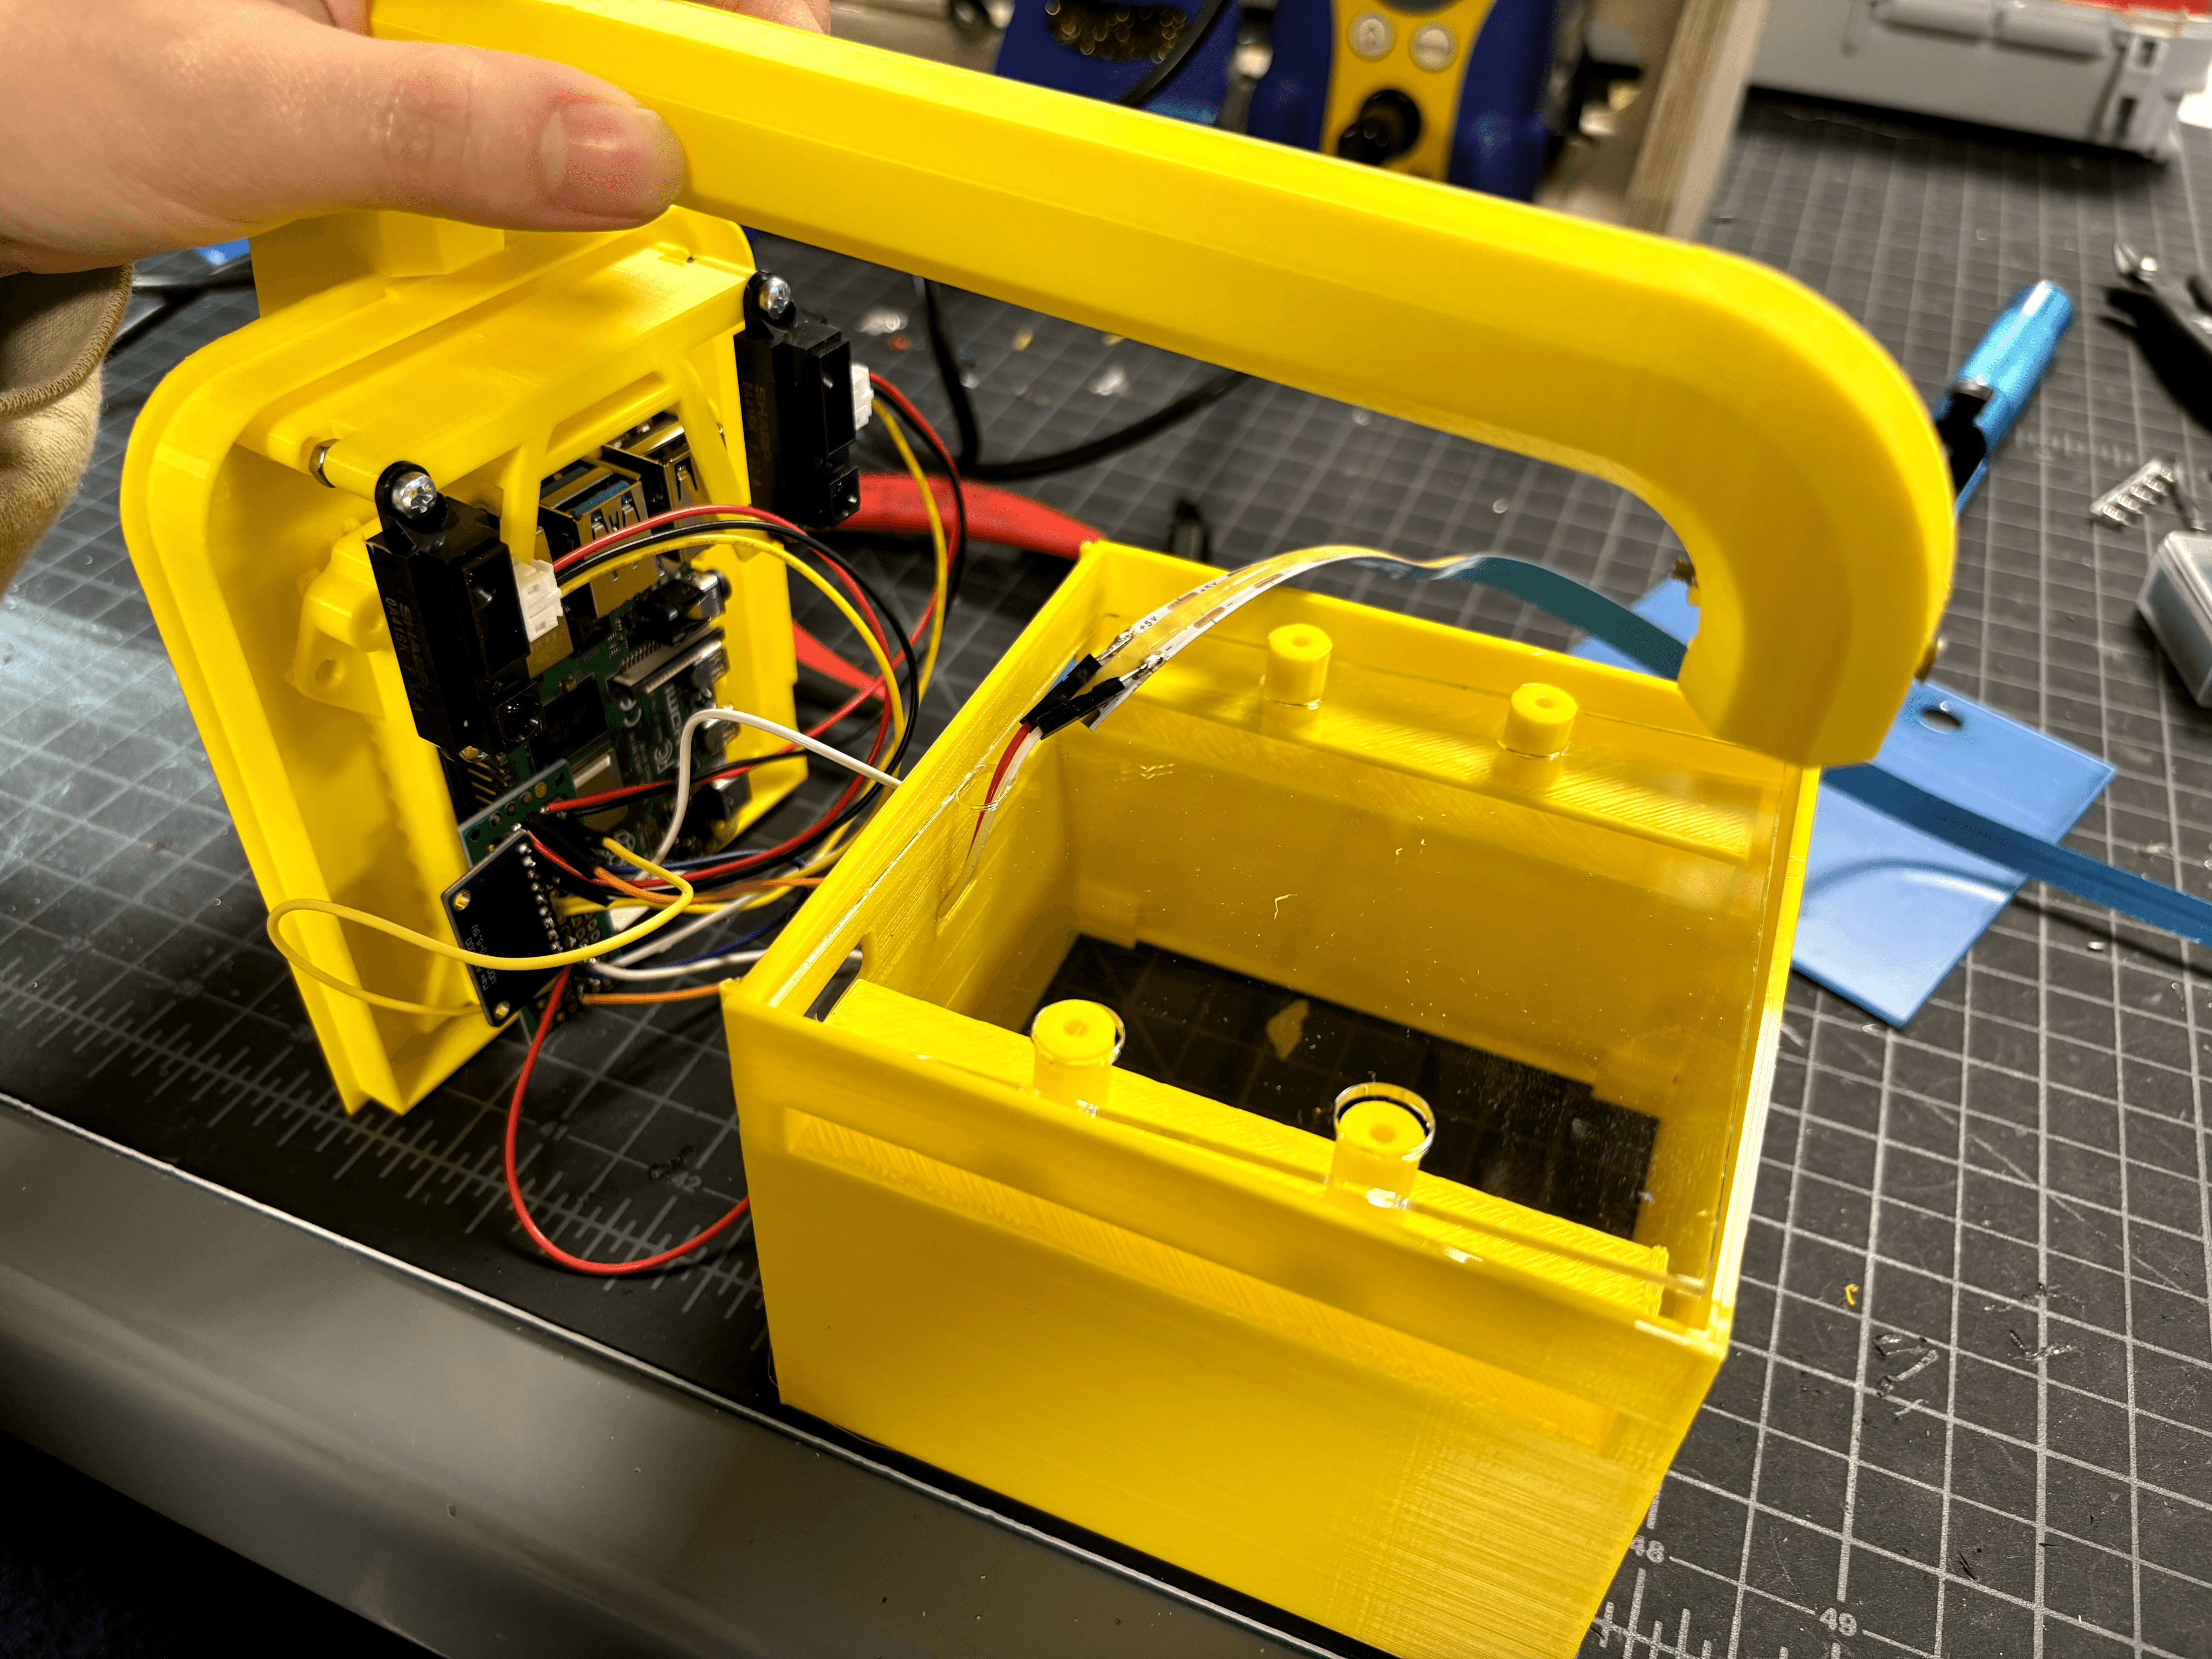
Hardware Structure

User Interface
Developed website 🔗https://brave-flower-0b9c8e71e.5.azurestaticapps.net
🔗 Figma file
Framework: HTML & CSS (Panda frame)
We succeed in:
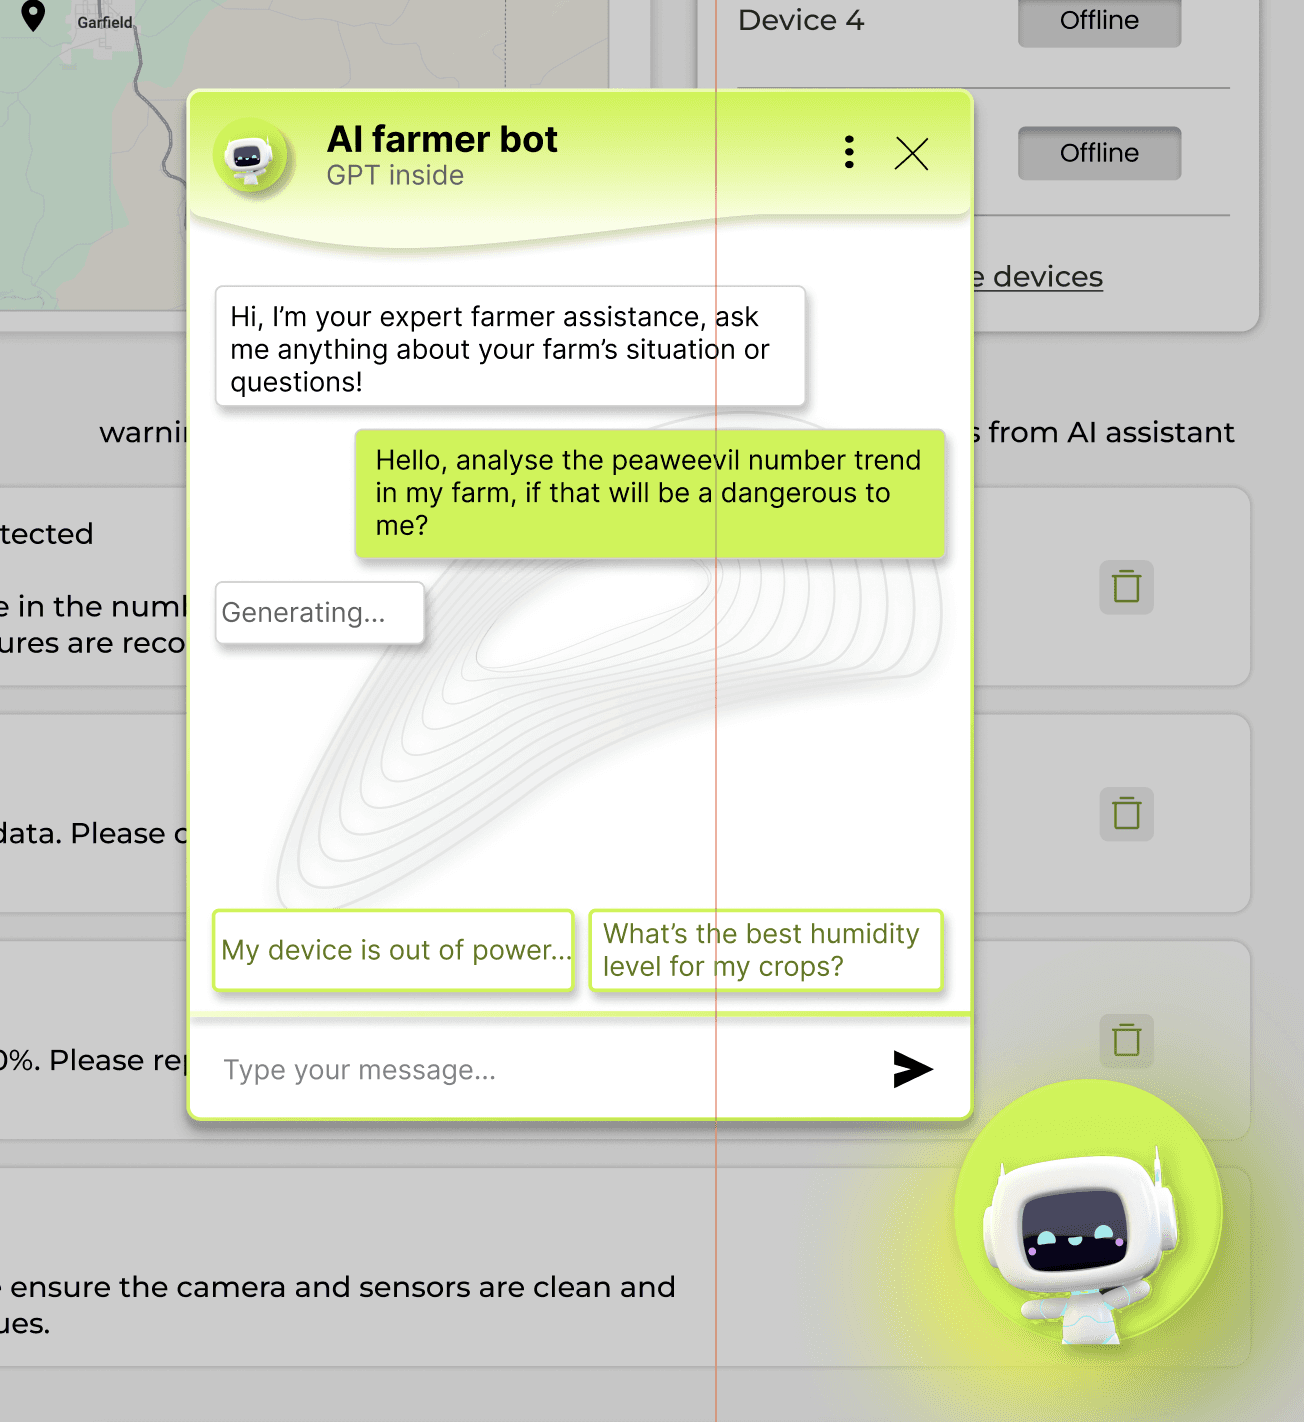
Connect GPT API into AI bot
Connect to back-end database(Azure) by using Flask
Allow user to remotely command device's camera through website app
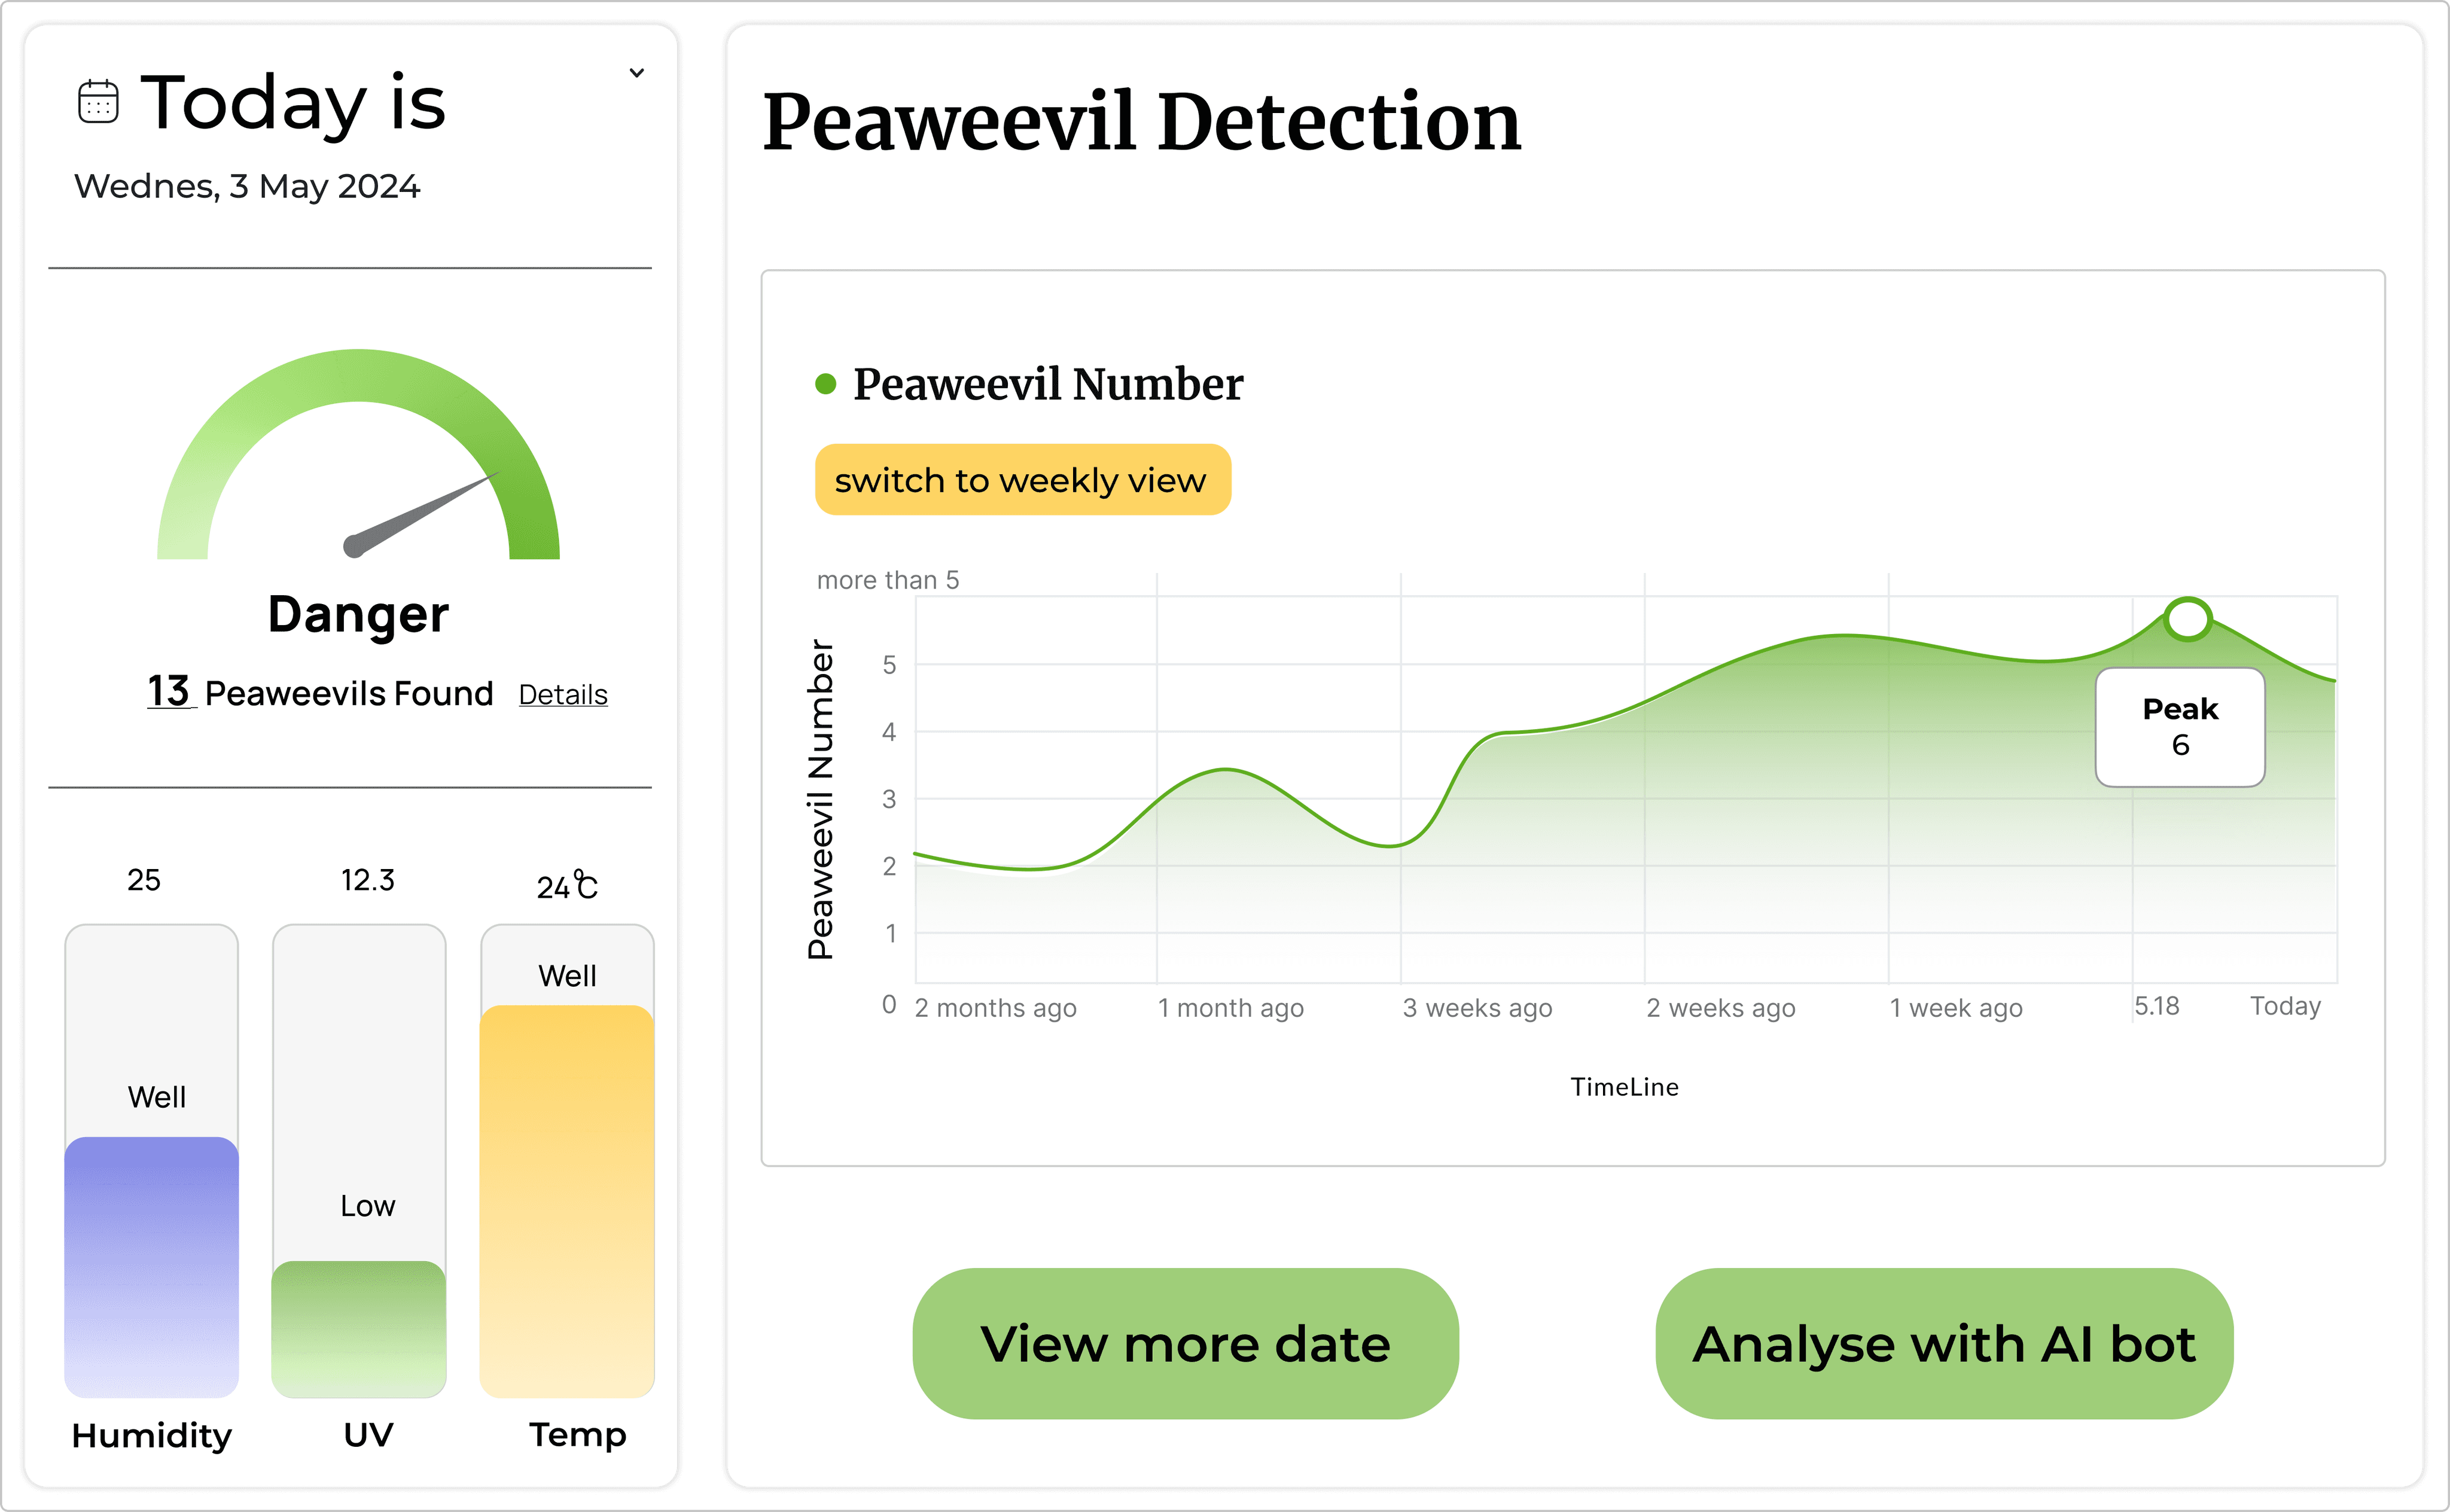
Data visualization

IoT Device Picture Library
Adaptive Capture & Error Management

AI chat bot
Hi-fi UI

Developed delivery
User Test & Iteration


1st: User feedback indicated a strong desire for the inclusion of weather and PH data in the home page visualization. This enhancement was made possible after resolving the data transmission issue via WiFi.
2nd: Usability testing revealed that users preferred to view weekly trends when pest data shows abnormalities. Additionally, providing a separate danger level indicator would better alert less experienced users to potential pest occurrences.


1st : Interaction analysis showed that AI-generated text alarms lacked engaging interactivity, leading to a need for more dynamic elements.
2nd: User onboarding insights revealed that users, particularly beginners, struggled with prompt usage, so example prompts were added to guide them effectively.


1st : User feedback highlighted the need for manual adjustment of pest counts in the database to ensure greater accuracy when system counts differ from user observations.
2nd : Visual design optimization was undertaken to improve the layout, enhancing the overall user visual experience.
Reflection
Aligning Design with Business Goals
Understanding that design must align with business objectives has been crucial. Focusing on specific, actionable problems ensures that our solutions are both effective and commercially viable. This approach not only improves user satisfaction but also supports overall business success.
Design Compromises under Technical Constraints
I discovered that design often requires compromises, especially when technical limitations arise. For instance, adapting our approach from advanced AI to simpler methods when faced with high costs was a key lesson in balancing innovation with practicality.
Collaboration and Communication
Actually my partner and I are all designer background, so we occur to lots of difficulties when do the code intensive project. Under the difficulties and short time line, I’ve learned the importance of clear and empathetic communication in teamwork. Navigating differing opinions and aligning on design decisions taught me how crucial it is to listen actively and integrate diverse perspectives to create cohesive and effective solutions.
Social Impact & Sponsor's Feedback
Our essay on this project is accepted by GHTC conference and all the code and design is open-source, which highlight our project's social impact and innovation. By combining cost-effective DSP and computer vision, we’ve set a precedent for accessible agricultural technology, validated by industry recognition and positive feedback from our sponsor.
This product brilliantly combines innovation with practicality, featuring waterproofing and reliable Wi-Fi data transmission that have resolved my long-standing issues with pea weevils.
The clear data visualization and integrated AI bot have made farm management significantly more efficient, allowing me to quickly address any questions.
Appendix
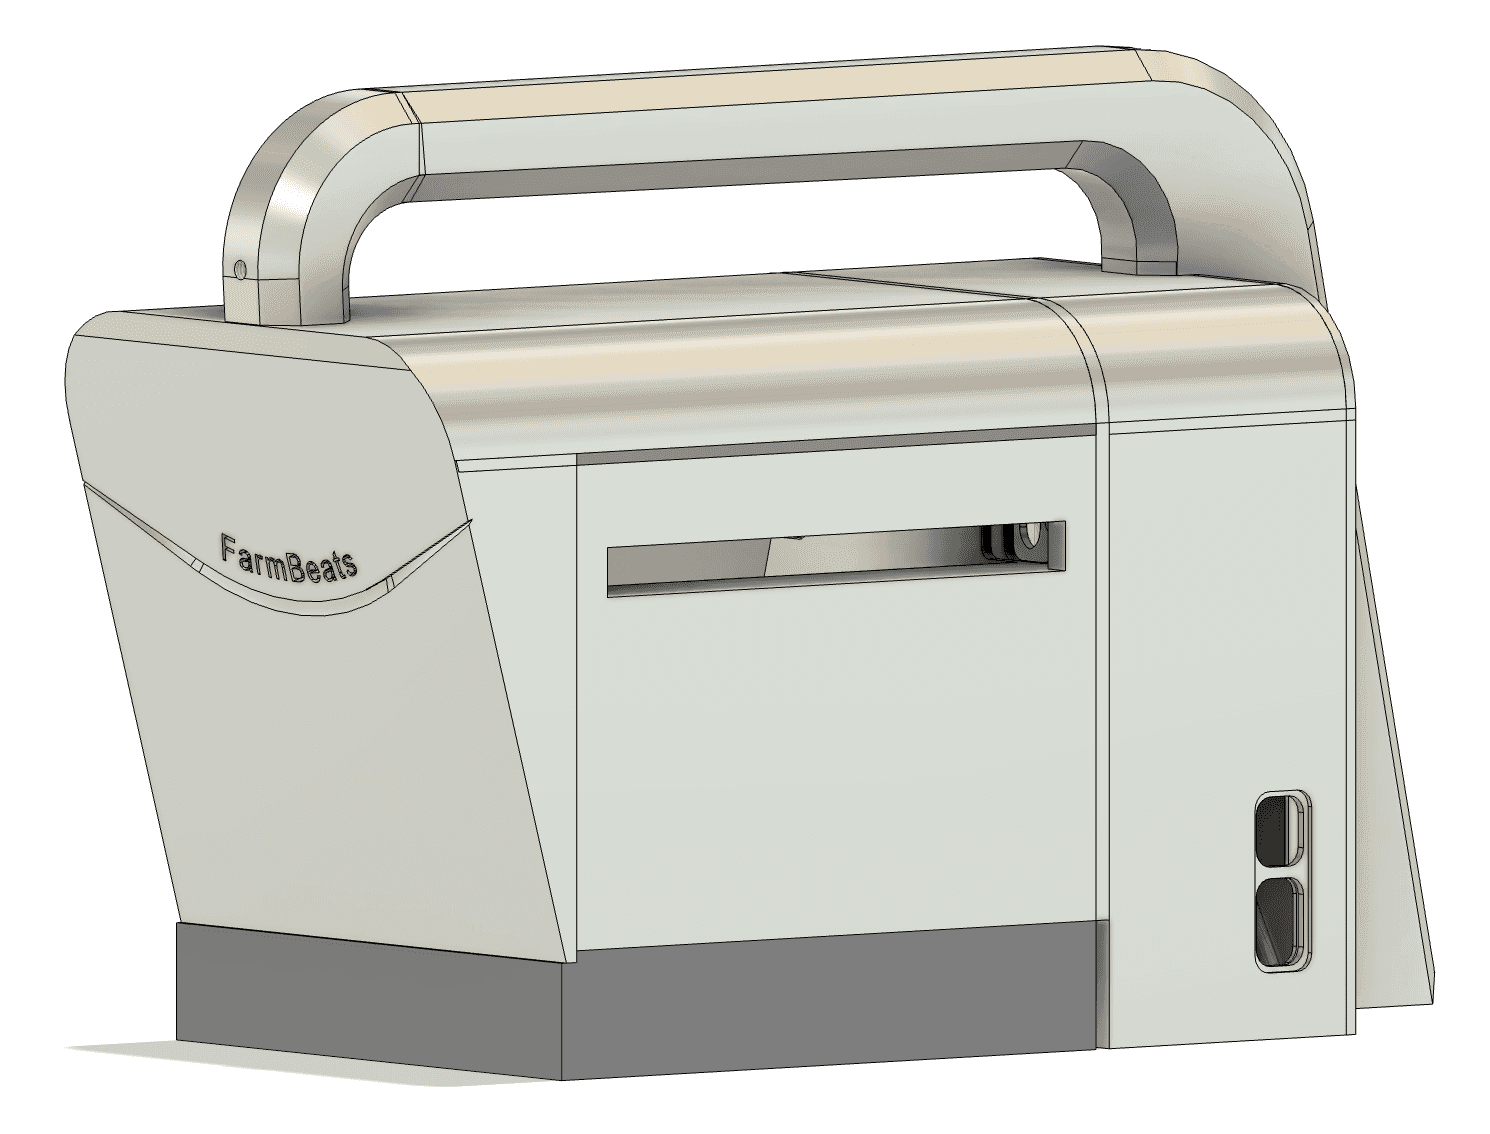
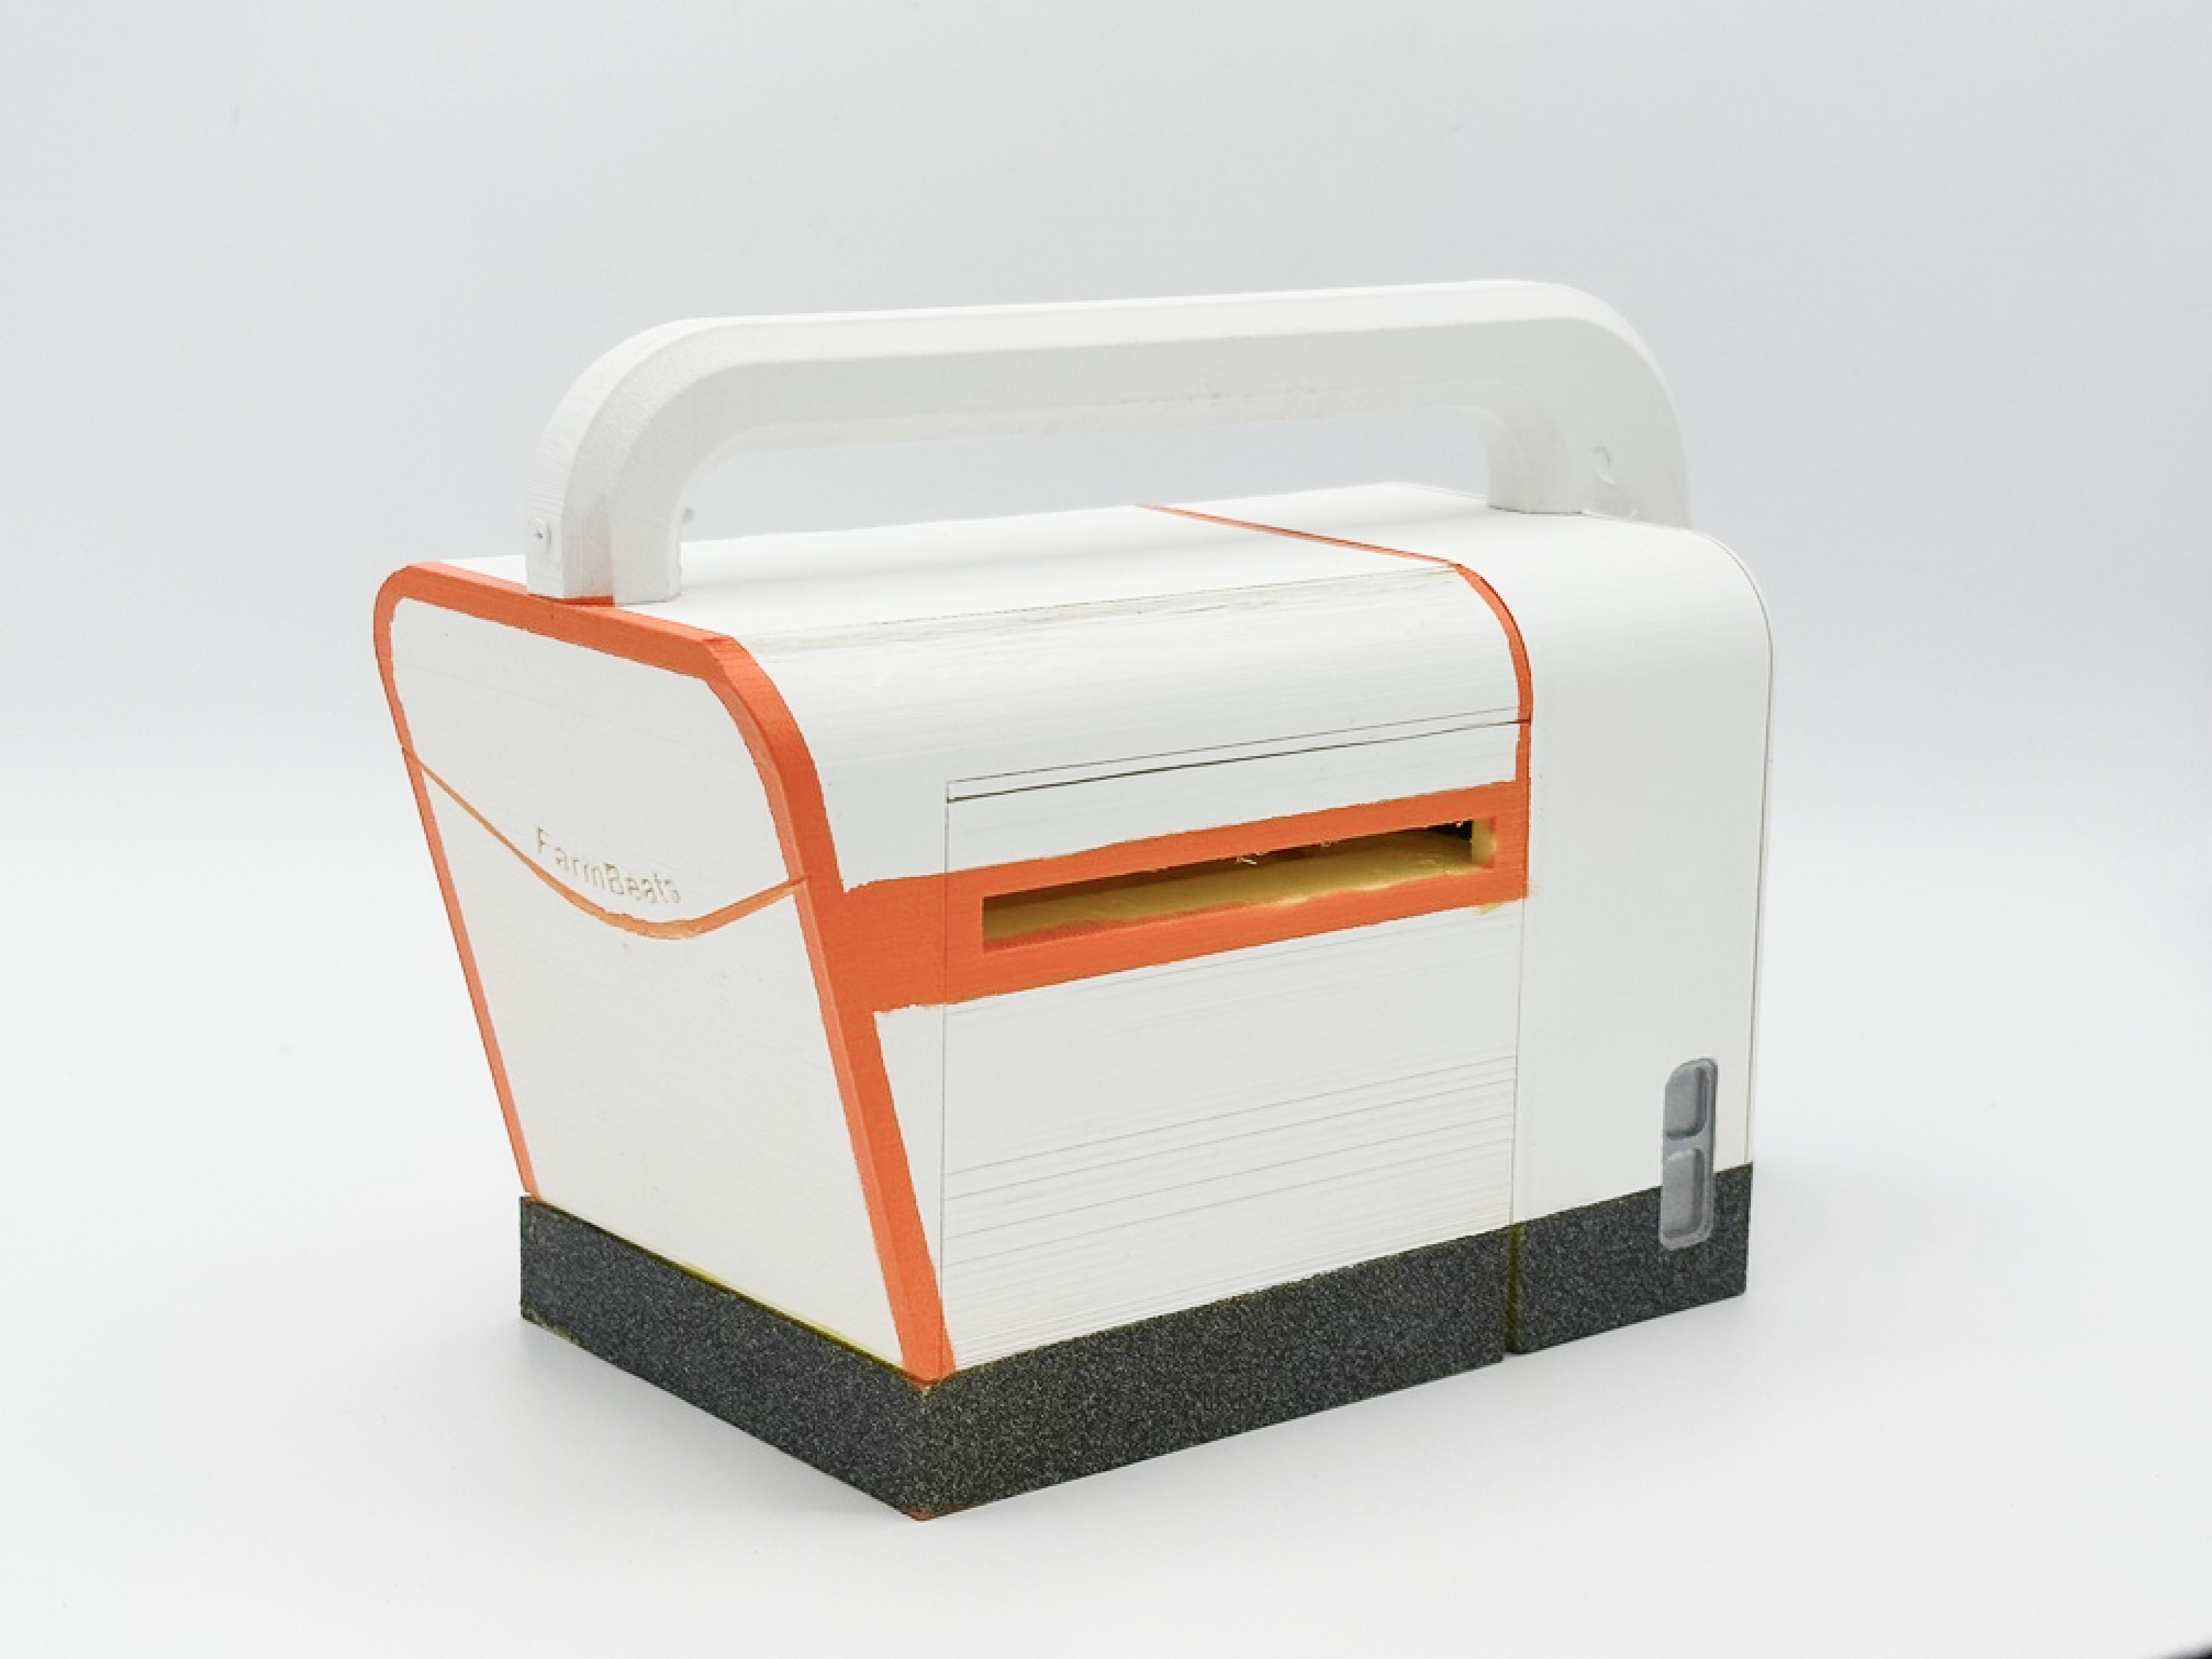
Product waterproof enclosure
methods: 3D Modelling——3D Print——Painting and assemble
main purpose: Water proof, hide the circuit, have a horomon drawer, have a gap to allow peaweevils fly in but not big stuff
Digital Signal Processing & Computer Vision
DSP Flow Chart
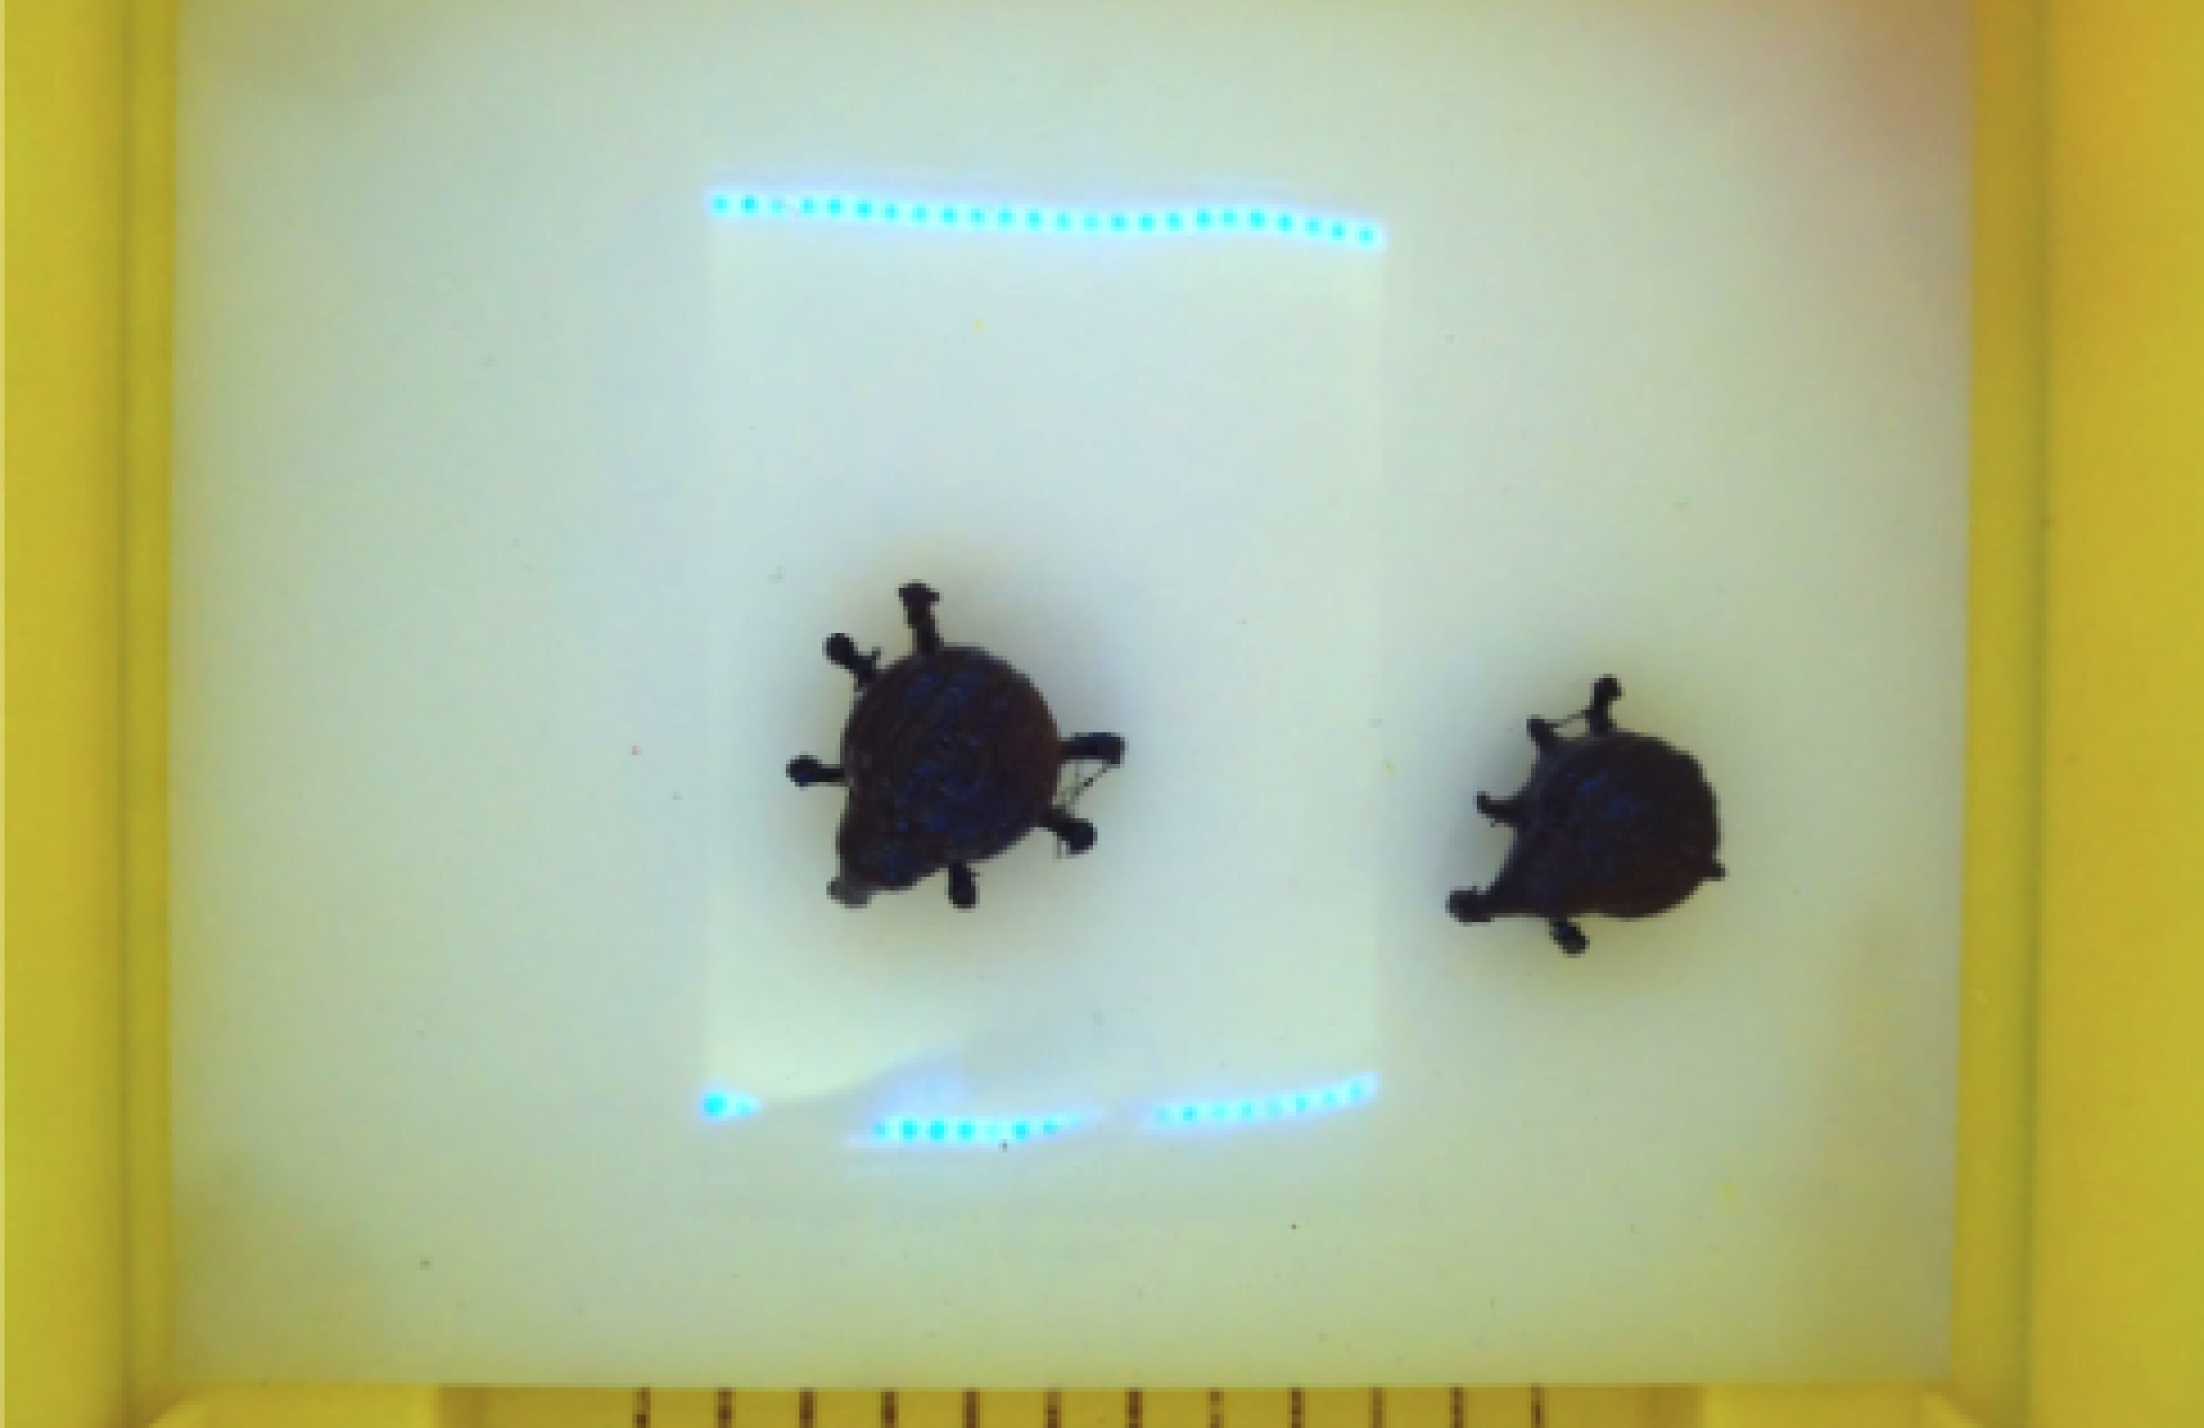
Raw image

Processed image
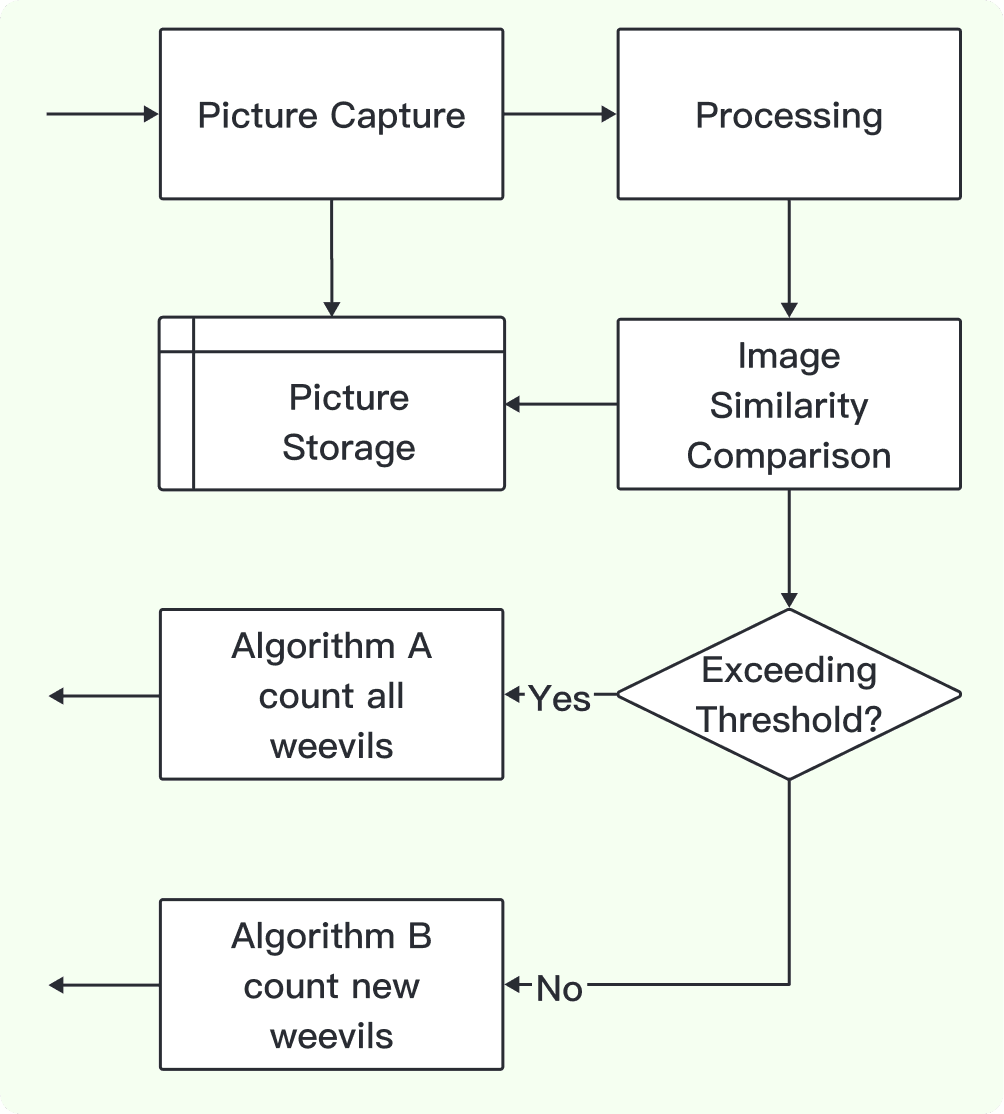
Digital Signal Processing
Count New Weevils
Azure Cloud Database
